A group from Sorbonne Universite, Inserm, Universite de Paris, France, etc. has reported on two groups with different COVID-19 immune profiles, that correlate with COVID-19 disease severity.
https://www.ncbi.nlm.nih.gov/pmc/articles/PMC8312547/
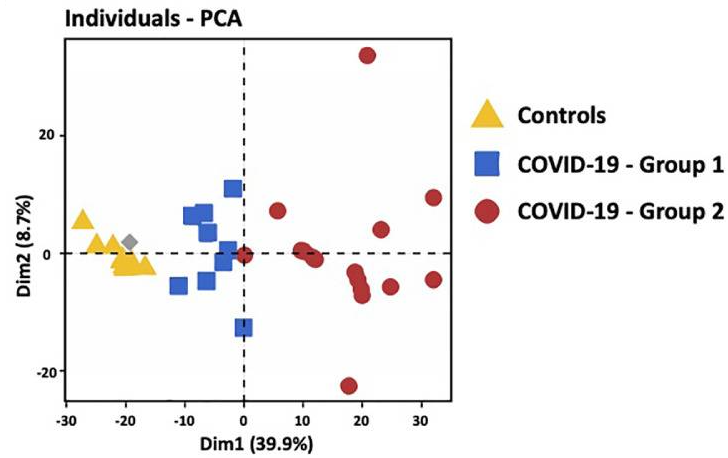
Strikingly, hospitalized COVID-19 patients segregated into two groups 1 and 2. Principal component analysis of transcriptomic features of whole blood at the onset of hospitalization revealed that group 1 (blue) was closer to healthy controls than group 2 (red).
Genes up-regulated in group 2 belong to signatures of myeloid cells, neutrophil activity, inflammatory response, TLR and type I IFN signaling pathways, and inhibition of T cell proliferation (i.e. arginase 1, PDL1, PDL2 and CD276/B7-H3). At the opposite, genes involved in CD8 and NK cell function, T cell activation, T helper (Th) differentiation, co-stimulatory receptors (TNFRSF4 (OX40), ICOSLG (ICOS ligand), TNFRSF18 (GITR) and TNFRSF11A (RANK)), and antigen presentation, were down-regulated in group 2. These results are compatible with the coexistence of patients with a distinct immune profile: (i) adaptive immune response triggering (i.e. group 1), (ii) exacerbated myeloid and innate responses, with dysfunctional adaptive immune response (i.e. group 2).
Patients of group 2 did not differ from group 1 for age and diabetes, but have a higher body mass index compared to group 1. The severity of respiratory distress in each group was estimated by the WHO score. Mild patients had a 4–5 WHO score, whereas patients requiring oxygen by NIV or high flow, mechanical ventilation or extracorporeal membrane oxygenation had >6 WHO score. Strikingly, almost all patients 94% from group 2 had severe respiratory distress (>6 WHO score) as compared to 25% (2/8) in group 1 (P = 0.0013). Differential biological variables between the two groups, reflecting other vital organs and tissues (i.e. liver, kidney, heart and blood vessels) were investigated. Among them Hepatic Steatosis Index (HSI) and prothrombin ratio (% PR) reflecting liver damage, urinary Na+ and Na+/K+ reflecting kidney injury, troponin for cardiac damage, and E-selectin and placental growth factor (PlGF) reflecting the vessel status were significantly different in group 2 patients as compared to group 1. Overall, multi-organ failure, potentially exacerbated by endothelium damage and thrombosis was more pronounced in group 2 patients. Finally, 88% of death belongs to group 2, underlying distinct clinical outcome associated with differential immune patterns of patients’ groups.
As for the immune populations between both groups, the group 2 was characterized by increased total leucocytes counts, with a profound lymphopenia, a decreased proportion of CD8+ T cells and increased proportion of CD4+ T cells, a decrease in NK cells and an increase of neutrophils. In addition, group 2 patients presented with higher plasma level of proinflammatory cytokines (IL-6, IL-8, TNF-α, soluble TNF receptor 2 (sTNFR2)). These data confirmed a higher inflammatory response, neutrophilia and reduced NK and T cell responses in group 2, whereas group 1 had a profile favoring an adaptive immune response. Of note, group 2 patients displayed a higher expression of TLR3 on PBMC.