Under Development. Stay tuned for updates!
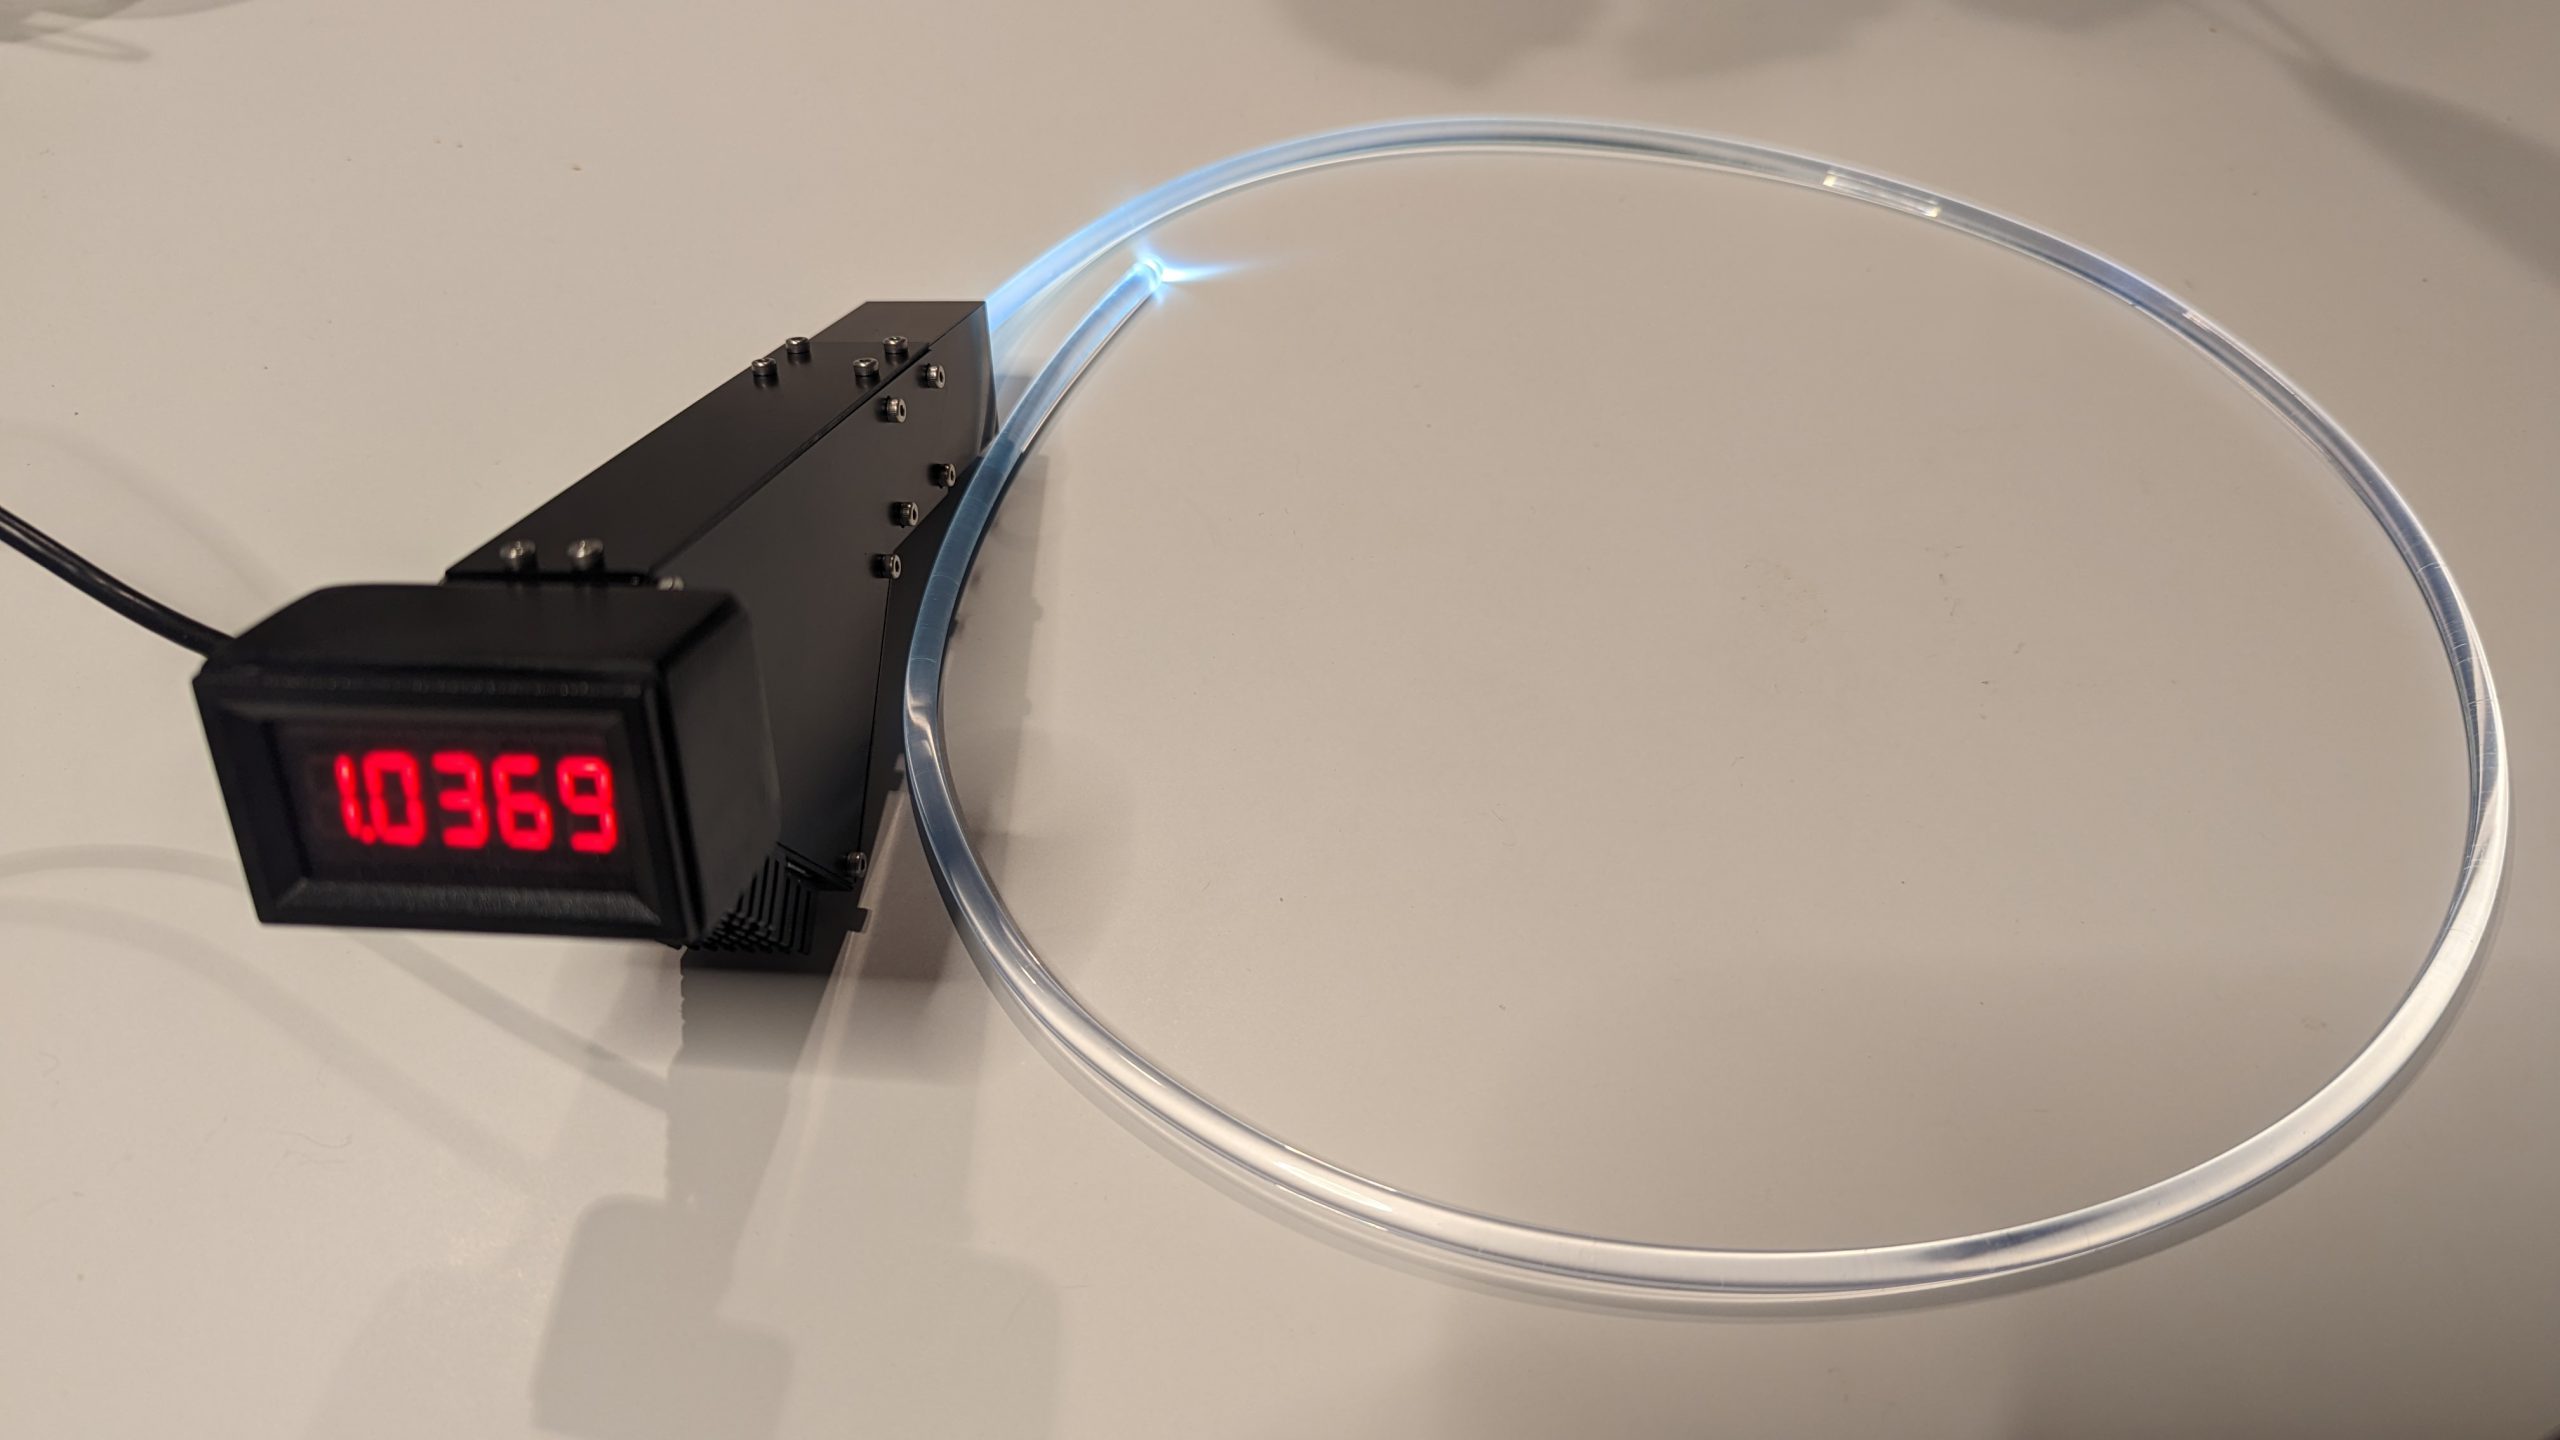
A patent has been filed for an innovative optic biome sensor technology which enables great cost reduction by reducing the number of optical parts thoroughly by redesigning the optical system, and also achieves high sensitivity and great reduction of optical noise (patent application 2022-146003 in JAPAN).

Sensitivity and bacterial measurement range of optic biome sensors

This biome sensor uses an optical fiber as a sensor, and a probe specific to the bacteria to be detected is immobilized on its end face. A special buffer solution is designed not to be affected by ambient light, but in order to eliminate the possibility of being affected by strong daylight or bright room lights, measurements should be basically performed in a dark room. Under such conditions, the output of this sensor is very stable with a noise level of ±0.1mV.
When using this biome sensor, warming up is necessary for at least 15 minutes to stabilize the detection system of the sensor. The noise level is then within ±0.1mV.
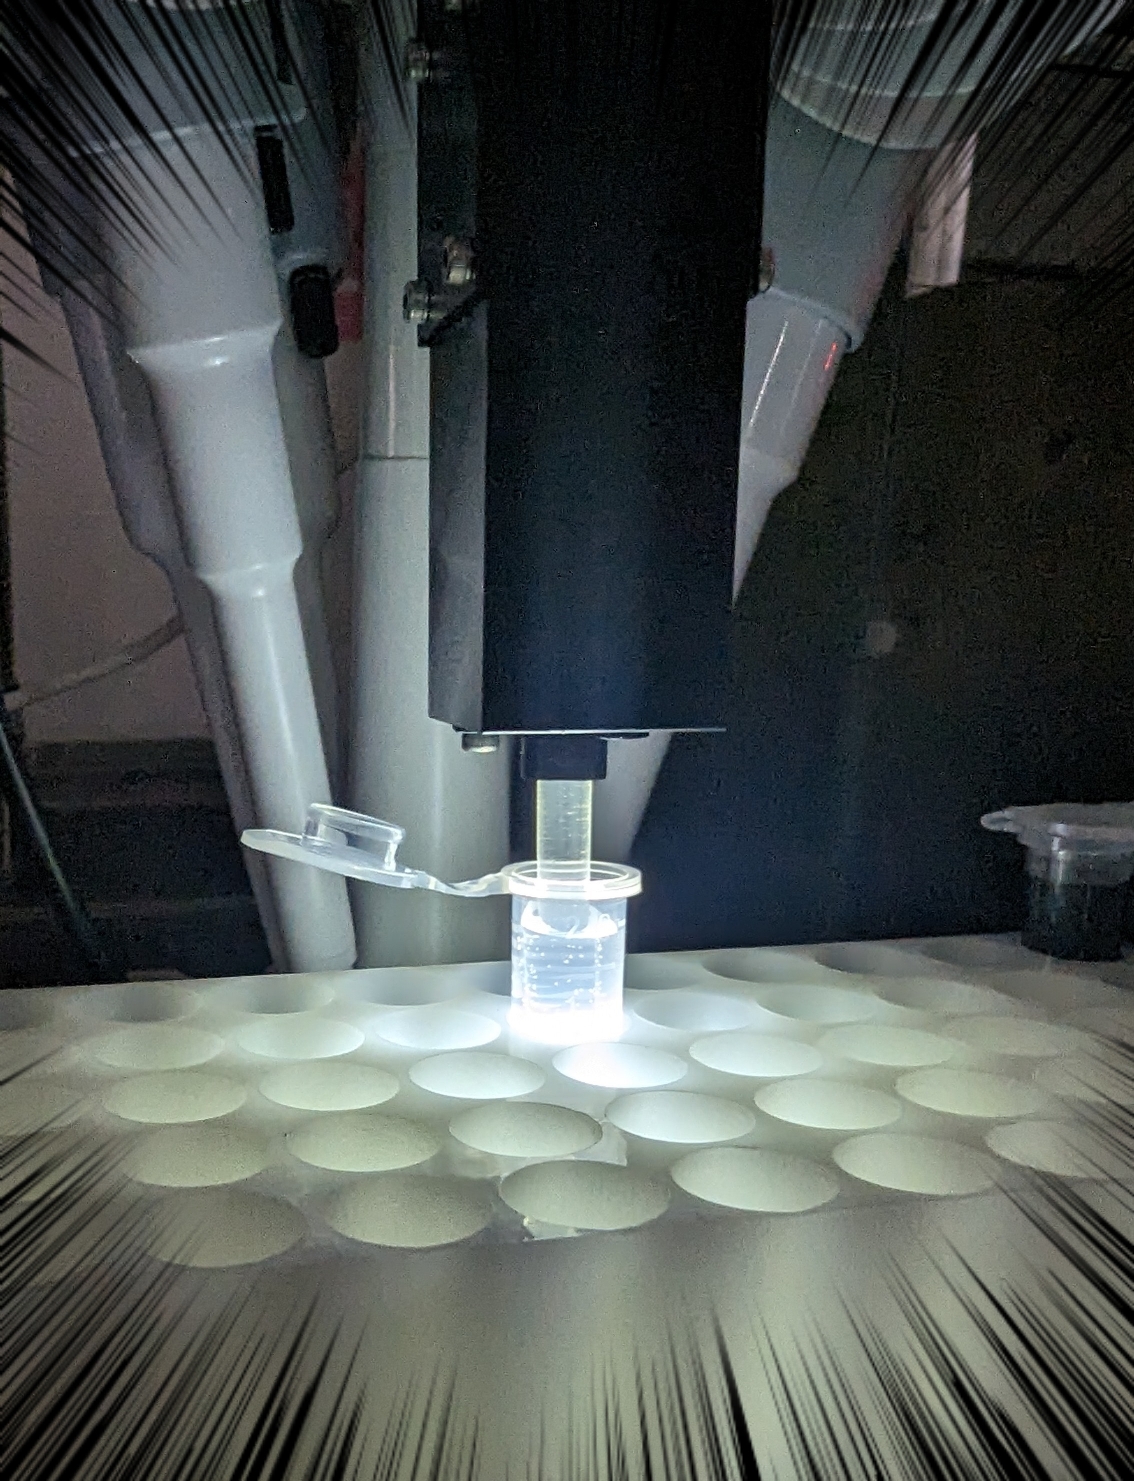
Add 1.5 mL of the sample solution to a 2 mL microtube and set it on the tube rack. Set this tube rack on the dedicated holder for this sensor, and lift it up until the sensor part on the end face of the optical fiber is immersed in the sample solution. The measurement will start immediately, so write down the output value of the sensor as the initial value in a few minutes after the optical fiber end face is immersed in the sample solution (0.7520V=752.0mV, etc.). Since the signal intensity changes rapidly when the sensor is immersed in the sample, wait for a few second, and take the signal value as the initial value when the signal changes slows down and stabilizes.
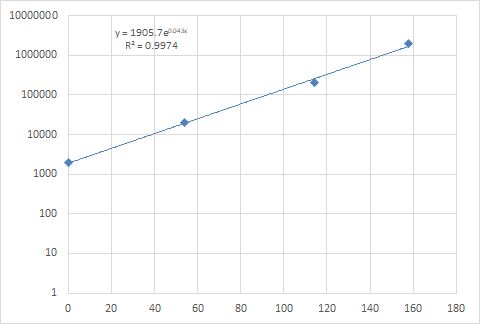
In this state, do not touch the measuring device at all, leave it for 5 minutes , and write down the output value of this sensor at that time. By subtracting the initial value at the start of the experiment from this value, you can obtain the amount of change in the signal value (in mV units) (X = change in signal in mV units, Y = bacterial concentration). By substituting this number into the fitting formula shown below, the concentration of the target bacteria in the sample can be obtained (number/cc). By using this sensor, the concentration of Bacillus bacteria can be read in the range from 2 million cells/mL to 2000 cells/mL as shownh below.

Bacillus (Gram-positive bacteria) belonging to the phylum Firmicutes is a representative beneficial bacteria in the rhizosphere. On the other hand, Pseudomonas (Gram-negative bacteria), which belongs to the phylum Proteobacteria, is also known as a representative beneficial bacterium. Let us also examine this type of bacteria.
Here is the sensitivity, measurement range, and calibration curve for Pseudomonas bacteria (Gram-negative bacteria). A newly developed probe has improved sensitivity to Pseudomonas bacteria, and enables measurement in a relatively wide low-concentration range (200,000 cells/mL to 200 cells/mL). The limit of detection (LOD) of this probe is considered to be around 100 cells/mL. With this probe, however, in the high-concentration region (over millions cells/mL), the signal began to decrease as the concentration increased, suggesting that the sensor surface had reached saturation. In fact, at a concentration of 200 million cells/mL, the amount of signal change was only a few mV.

In the future, we are going to proceed with the optimization of probes for these bacteria to ensure simple measurements. The data will be updated as necessary according to the progress of research and development.
Sample preparation method
Please follow the instructions provided with this sensor. We will make it available for download from this website.
