Principal Component Analysis
Outline
Principle Component Analysis, PCA, is a way to characterize data by reducing dimensions.
This software could reduce the dimensions to two to three dimensions.
Operation Procedure
Click Principal Component Analysis from the Main window or from the side menu. The following window comes up.
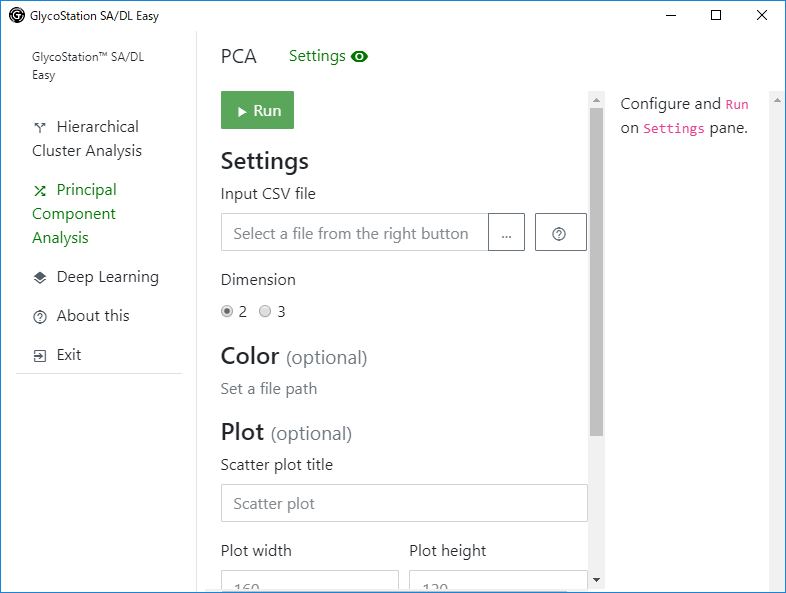
You could open and close Setting panes from the Settings on the topside menu. When the eye icon is open, you could close Setting panes by clicking the icon, and when the eye icon is closed, you could open it by clicking the icon..
You could set the followings from the Setting panes.
| Setting | Quick Explanation | Required |
|---|---|---|
Input CSV file |
Input a path of Input CSV File. | o |
Dimension |
Select dimensions. | o |
Color |
Select a color for each classification. When it is off, the default color is black. | x |
Draw arrows? |
Select arrow drawing on a scatter plot. Ineffective on three dimensions. | x |
Draw ellipses? |
Select ellipse drawing on a scatter plot. Ineffective on three dimensions. | x |
Scatter plot title |
Specify scatter plot title. Ineffective on three dimensions. | x |
Plot width, Plot height |
Input scatter plot size. | x |
Legend position |
Specify scatter plot legend position. When none was selected, no legend on the scatter plot. Ineffective on three dimensions. |
x |
Plot marker |
Select plot marker shape. Ineffective on three dimensions. | x |
After the setting, click Run.
When the Run button is clicked, necessary libraries are installed, and then, PCA is executed.
Two dimensions is selected, resulting scatter plot and its summary are displayed as below.
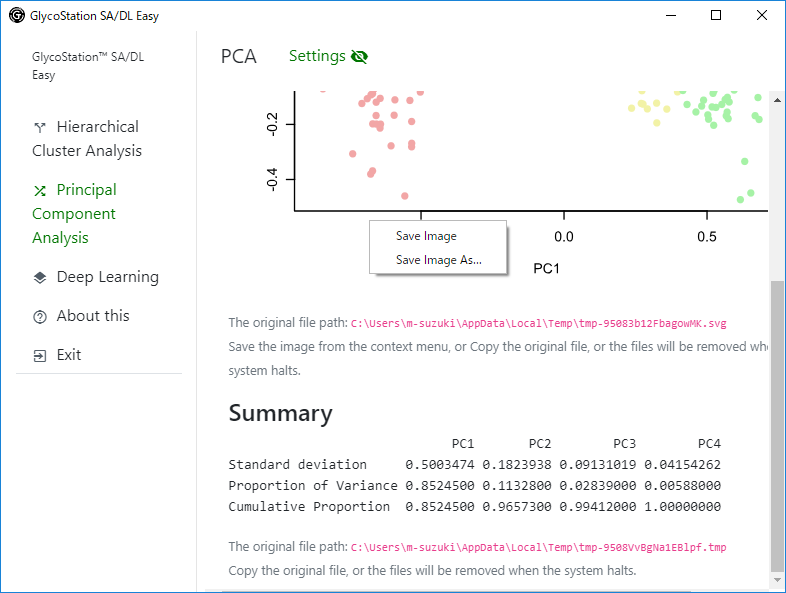
Scatter plot could be saved by right-click. By clicking Save Image menu, the image could be saved in a download folder. By clicking Save Image As... menu, you could specify a destivnation save folder. However, make sure to add file extention of .svg as an image type.
The summary could be copied with highlighting the target and selecting a copy by right-click.
Three dimensions is selected, a directry path including a three dimensional scatter plot and a related html is shown.
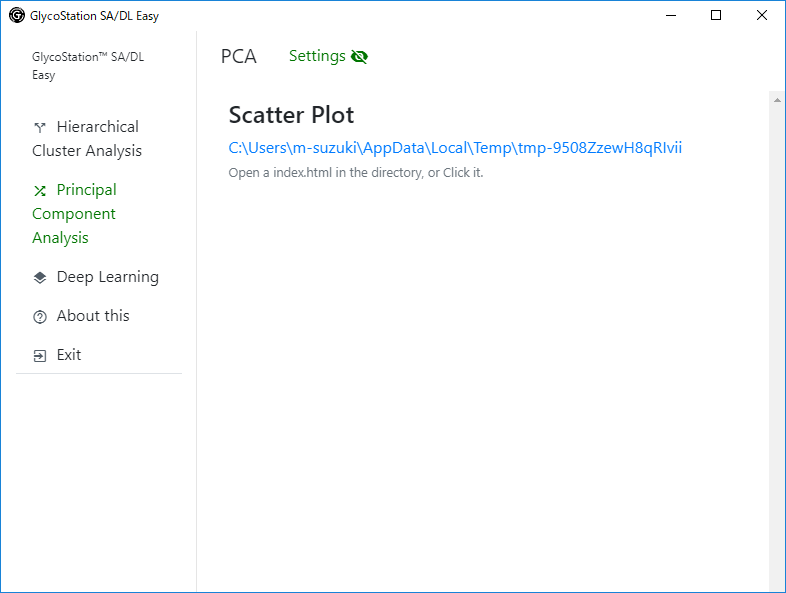
By clicking the directory path, a browser starts up and show a three dimensional scatter plot. You could save the image by right-click on Google Chrome and/or Firefox.
On this image, the original file path could be dispalyed. By copying the original file path to a different directory, the result could be also saved. The original file is stored in a temporary directory. The temporary folder would be deleted when the system as shutdown (it would not be deleted when the software was ended.).