Hierarchical Clustering Analysis
Outline
Hierarchical Clustering Analysis, HCA, is a way to analyze distances among clusters. It generates hierarchical structure by clustering samples according to the distance in order.
Operation Procedure
Click Hierarchical Clustering Analysis from the Main window or from the side menu. The following window comes up.
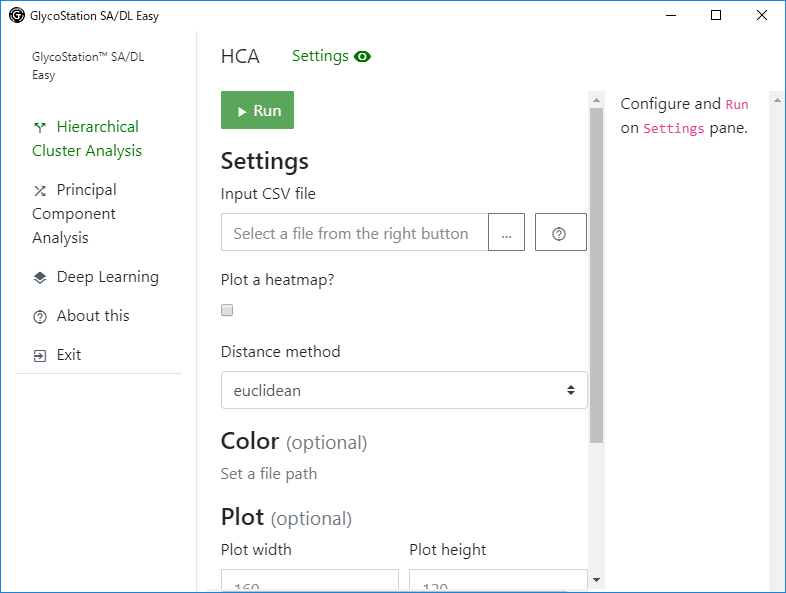
You could open and close Setting panes from the Settings on the topside menu. When the eye icon is open, you could close Setting panes by clicking the icon, and when the eye icon is closed, you could open it by clicking the icon.
You could set the followings from the Setting panes.
| Setting | Quick Explanation | Required |
|---|---|---|
Input CSV file |
Input a path of Input CSV File. | o |
Plot a heatmap? |
When it is checked, a heatmap is displayed, and when it is off, dendrogram is displayed. | o |
Distance method |
Select a distance calcurating method. | o |
Color |
Set a color for each classification label. When it is off, the default color is black. | x |
Plot width, Plot height |
Input image plotting size. | x |
Plot horizontally? |
When it is on, show dendrogram in a transverse manner. | x |
Label size |
Input size of label letters. | x |
After the setting, click Run.
When the Run button is clicked, necessary libraries are installed, and then, HCA is executed.
After the execution, dendrogram and/or heatmap is displayed as shown below.
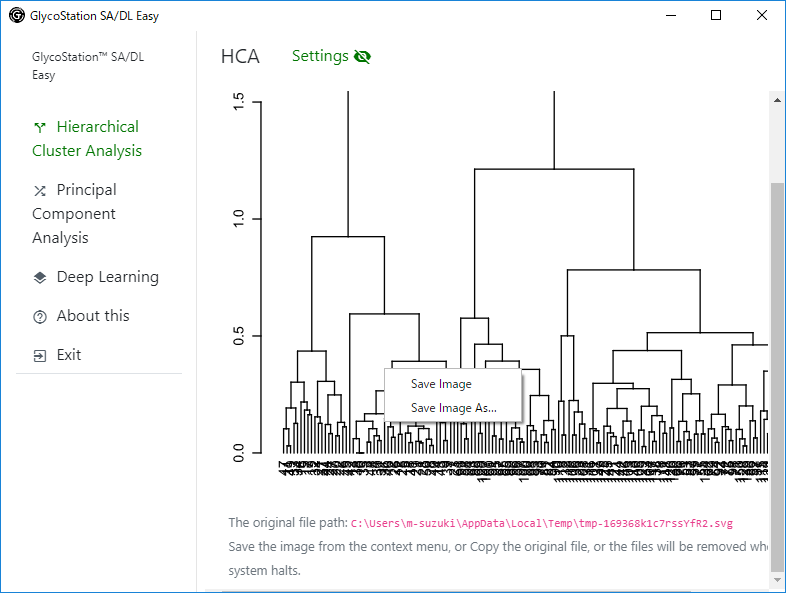
Graphical images could be saved by right-click. By click Save Image menu, the image could be saved in a download folder. By click Save Image As... menu, you could specify a destination save folder. However, make sure to add file extention of .svg as an image type.
Under the image, the original file path could be dispalyed. By copying the original file path to a different directry, the result could be also saved. The original file is stored in a temporary directory. The temporary folder would be deleted when the system was shutdown (it would not be deleted when the software was ended.).